RRDtool as a time series datastore for sensor data

RRDtool is a high performance data logging and graphing system for time series data. It doesn’t have a query language such as SQL, nor is it a NoSQL document store. Instead, you can store floating point numbers and accompanying timestamps there, and configure some aggregates.
RRD in the name comes from Round Robin Database, which means that the size of the database is decided when it is created, and once filled completely, the values are overwritten from the beginning. RRDtool has accompanying software for graphing the data called rrdgraph.
Required hardware and software
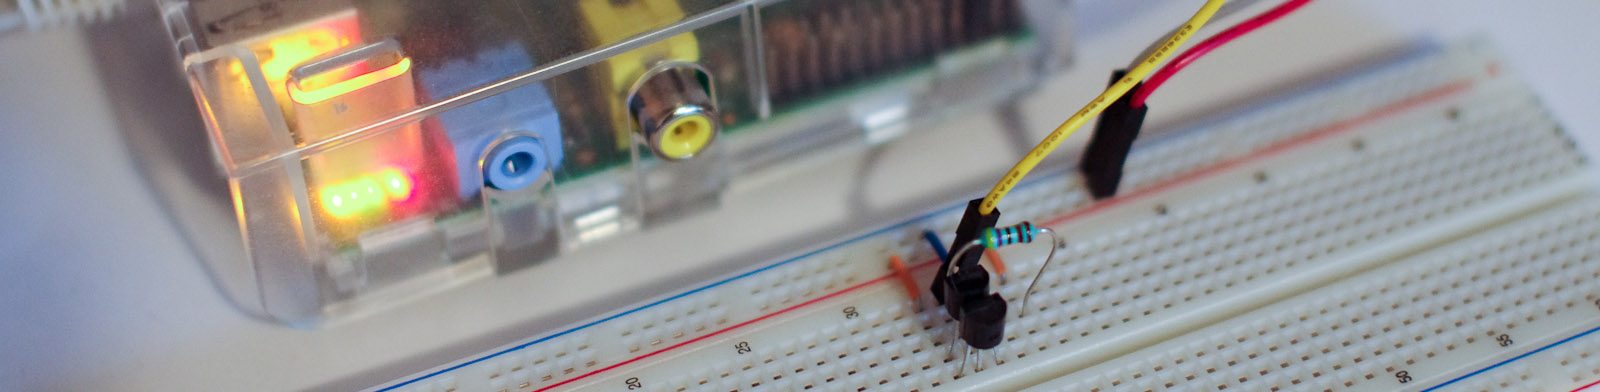
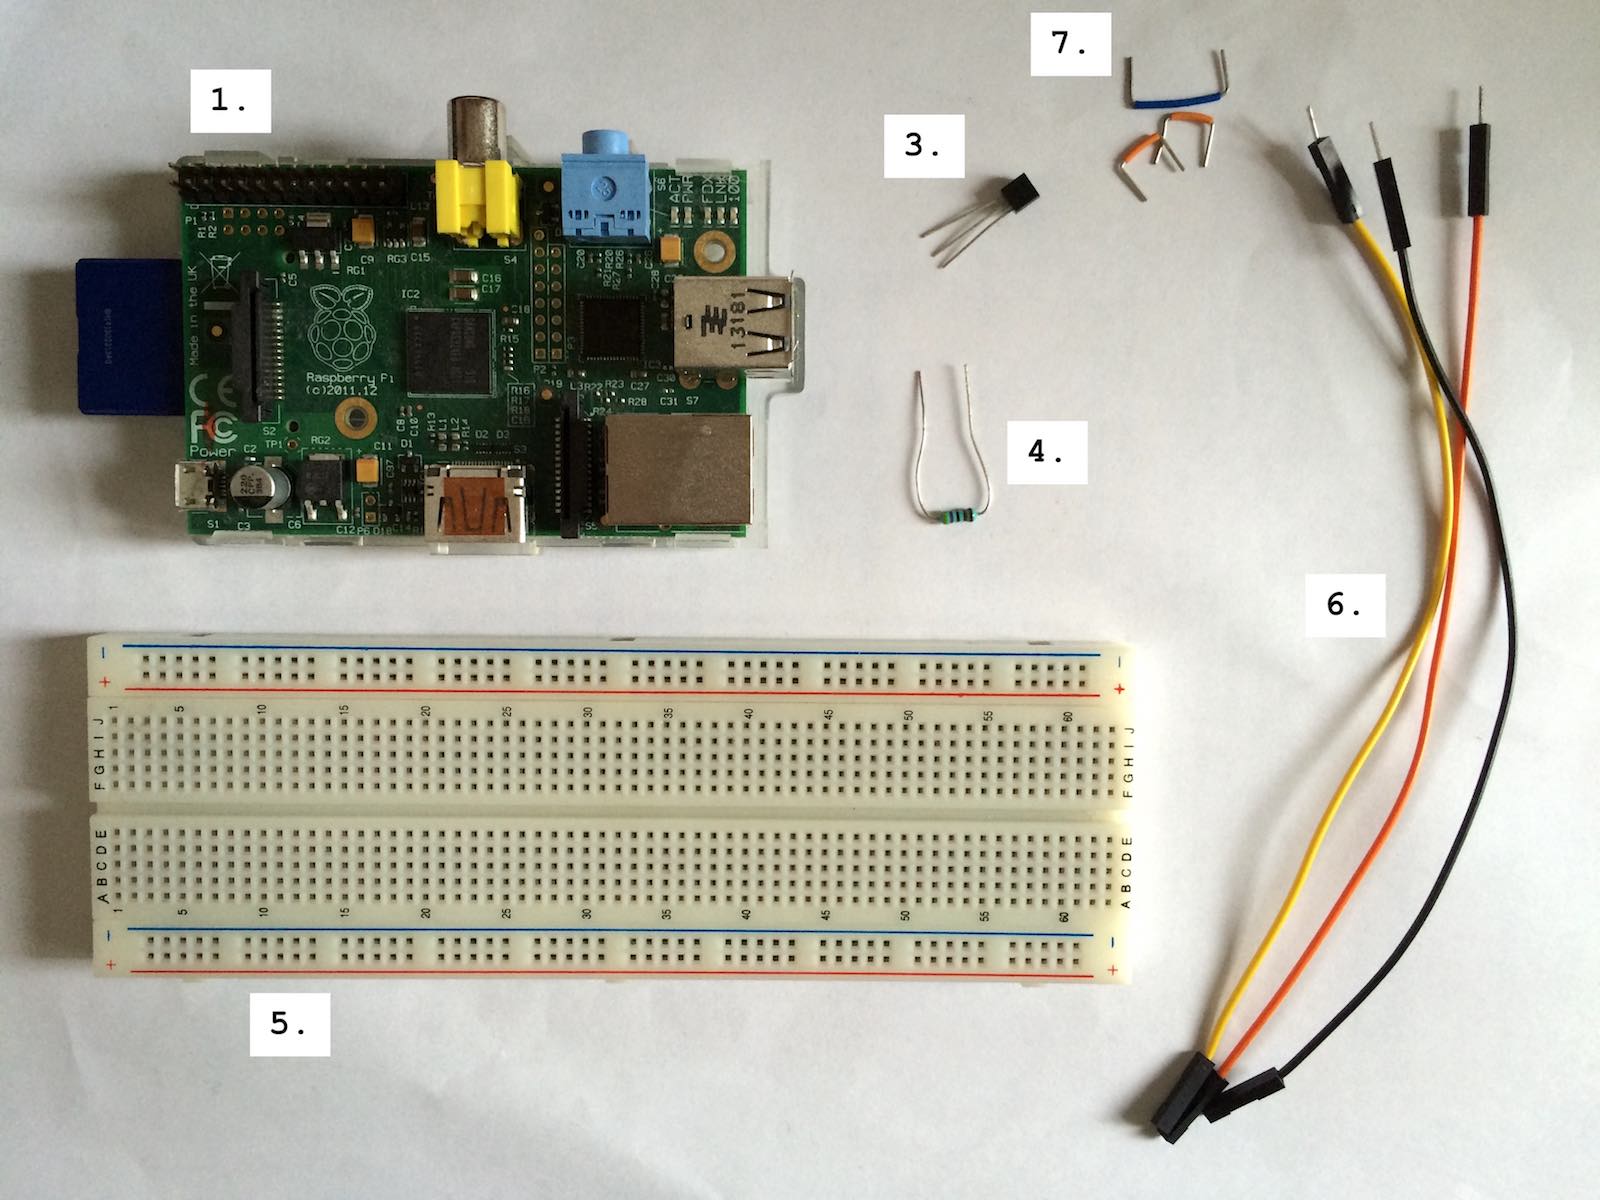
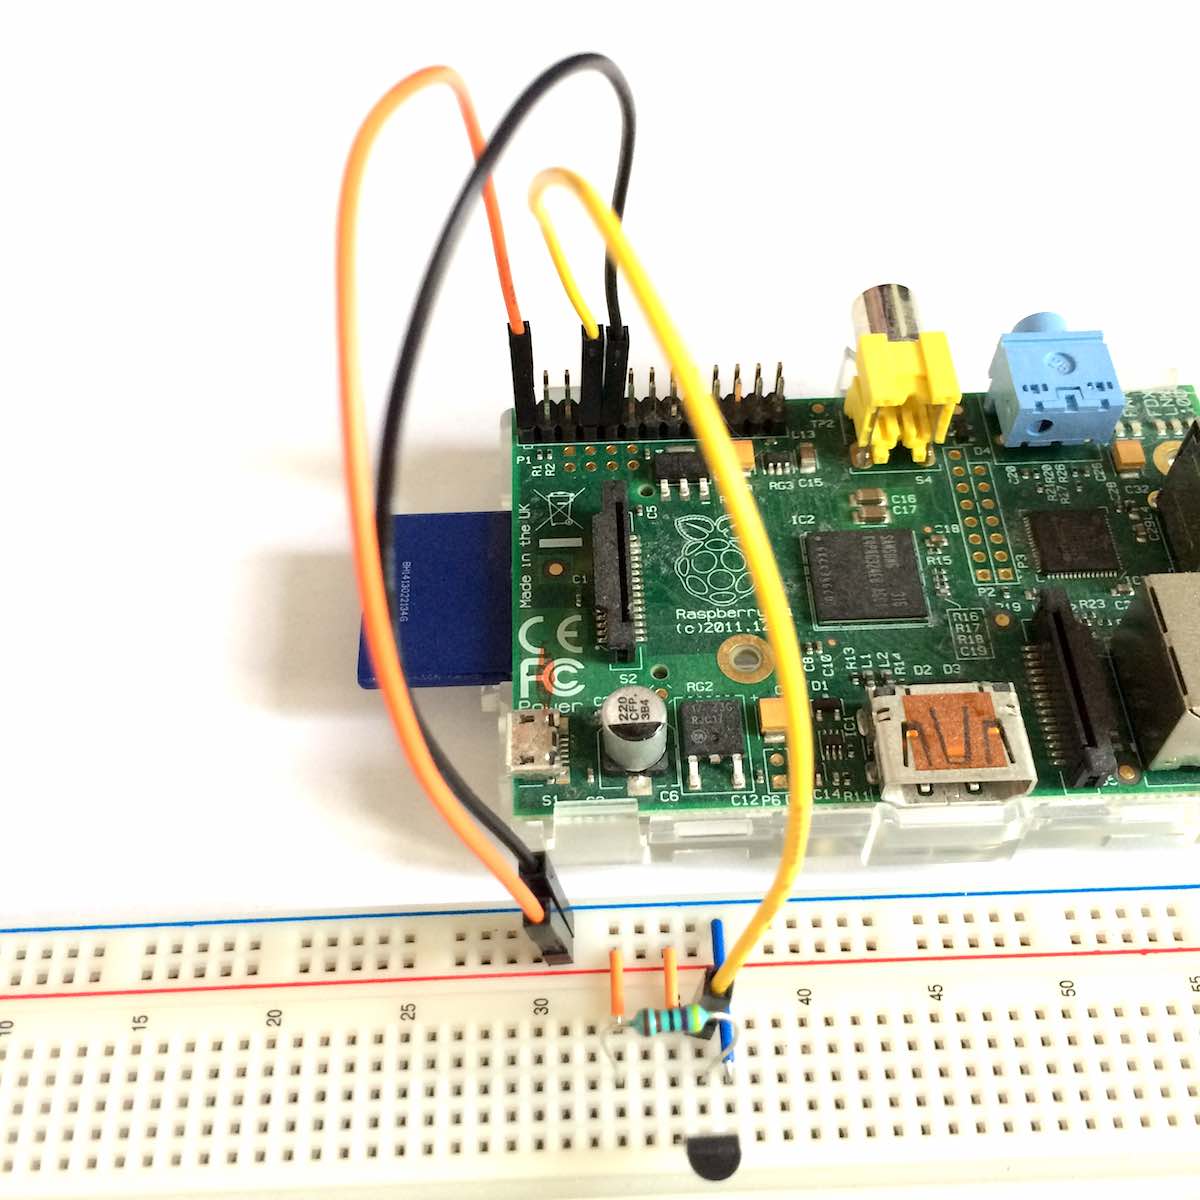
- Raspberry Pi
- Ansible and clone of raspberry-ansible repository configured with correct IP addresses and SSH keys
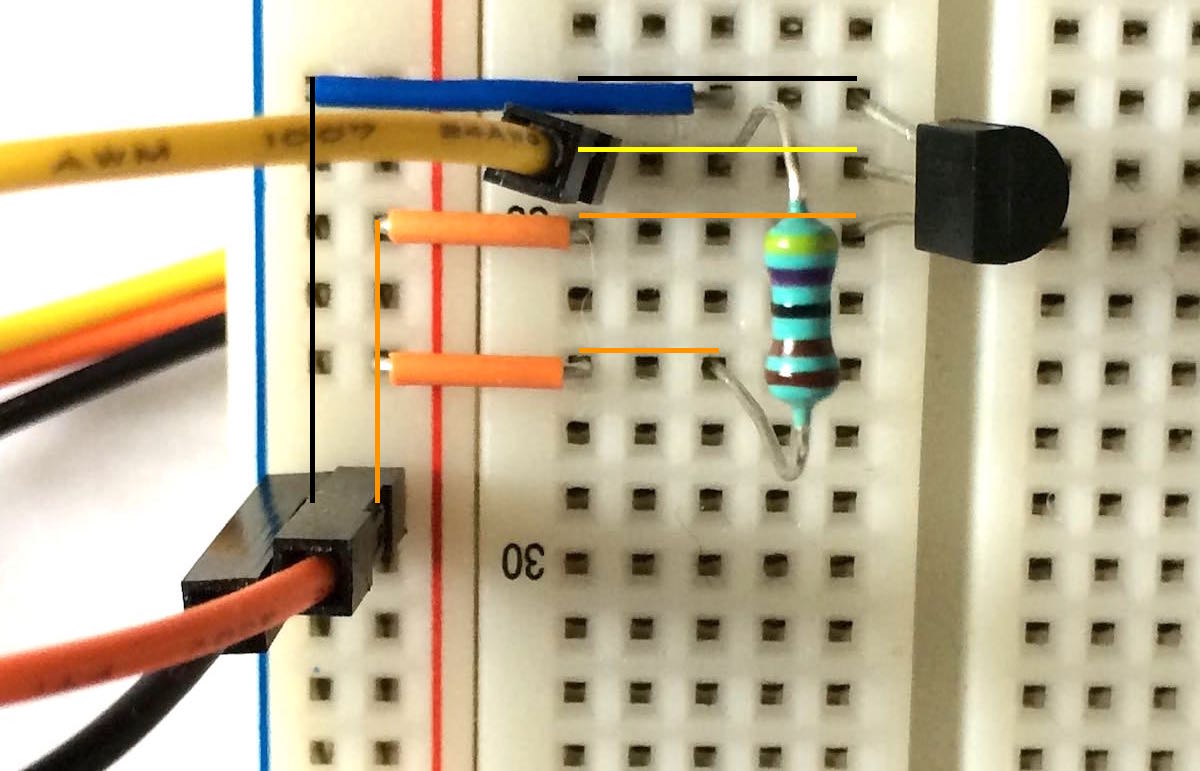
- One or more DS18B20 or compatible temperature sensors, see previous blog post
Installing temperature reading script
Running the Ansible playbook tempreader-rrdtool.yml installs a python script
that reads all connected 1-Wire temperature sensors to RRDtool databases (one
file for each sensor, files are created if they don’t exist). It also adds the
temperature reading to be executed every five minutes as a cron job.
$ ansible-playbook -i hosts tempreader-rrdtool.yml
After which the Raspberry’s pi-user’s home directory should have files like
these and a cron job:
pi@raspberry1:~ $ ls
0000075f24dc.rrd  0000075f5202.rrd  current.png  readtemp-rrd.py

pi@raspberry1:~ $ crontab -l
...
#Ansible: read all temperature sensors to rrd
*/5 * * * * /usr/bin/python /home/pi/readtemp-rrd.py
The first two files are RRDtool databases for temperature sensors with ids
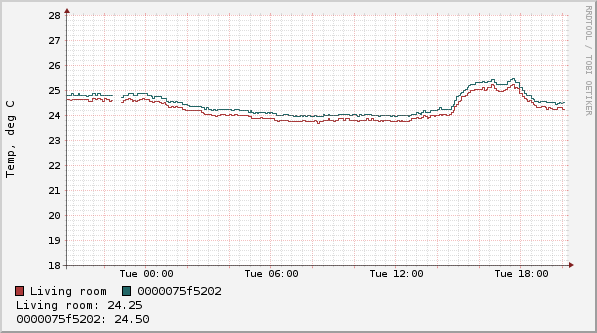
0000075f24dc and 0000075f5202. current.png is a graph of last day’s temperatures
from each sensor generated with RRDtool’s graphing function. And readtemp-rrd.py
is the python script.
Crontab syntax means that the command
/usr/bin/python /home/pi/readtemp-rrd.py is run every five minutes.
Setting up a RRDtool database for time series data
Diving into readtemp-rrd.py,
first imports show that we are using external library
rrdtool by Christian Kröger for
using RRDtool from python.
The setting DATABASE_PATH defines where the database files are stored. Each sensor
has its own database file.
DATABASE_PATH = '/home/pi/'
create_rrd_unless_exists creates an RRDtool database file unless one exists
already using rrdcreate
(or its python bindings). The data definition syntax is not simple, but
first --step tells how frequently data is expected, 300 seconds being once
every five minutes.
Then a data source (DS) called temp of type GAUGE is created. Gauges
are for data that is just values which can increase or decrease over time,
such as temperature. Next number is the heartbeat: how many seconds may pass
without a new value before the data source is regarded as unknown, here
900 for 15 minutes. -100 is the minimum and 100 the maximum value for this
data source.
RRA stands for round robin archive which is used for storing the read data.
Data is run through a consolidation function (CF), here AVERAGE. Average
is taken over 10 minutes (2 data points) and database has space for
10 years: 525600 of these 10 minute average values, if my math is correct.
As the name suggests, when this time has passed, the database values will be
overwritten from the beginning. This 10-year database for one sensor takes 4.1MB
of space, so Raspberry wouldn’t choke even if there were more than two sensors.
rrdtool.create(
    filename,
    '--step', '300',
    'DS:temp:GAUGE:900:-100:100',
    'RRA:AVERAGE:0.5:2:525600'
)
Current stable RRDtool version 1.6.0 supports giving these time arguments with easier syntax so that you don’t have to calculate for example how many 10-minute periods there are in 10 years. Unfortunately Raspbian Jessie has version 1.4.8 which doesn’t.
Reading temperature sensor data with Python
The temperature reading part uses Timo Furrer’s w1thermsensor python library, which makes the readings really straightforward.
Code loops through all the sensors, creates a RRDtool database for each sensor unless it exists, reads the temperature value and writes it to the database and prints it to standard output as well.
Writing to database uses
rrdupdate, which has a
relatively easy syntax: first parameter is a timestamp (N for now), following
ones are values. %.2f is python syntax for formatting a decimal number as
a string with two decimals.
for sensor in W1ThermSensor.get_available_sensors():
    filename = sensor.id + '.rrd'
    create_rrd_unless_exists(filename)
    error = rrdtool.update(filename, 'N:%.2f' % (sensor.get_temperature()))
    print("Sensor %s has temperature %.2f" % (sensor.id, sensor.get_temperature()))
Graphing time-series data with RRDtool
RRDtool has functionality for generating graphs from databases included with command rrdgraph. Unfortunately its syntax is even more complex than database creation’s.
But first, the following static variables are used for configuring graph generation:
LAST_DAY_GRAPH_FILESis the path for current day’s temperature graph fileCOLORSare used when graphing, first sensor’s line is drawn with the first color, second sensor with the second color, etc.SENSOR_NAMEScan be used to give the sensors meaningful names, which are used in the graph legend. Sensor ids are used if names are not given.
LAST_DAY_GRAPH_FILE = '/home/pi/current.png'
COLORS = ('#AA3939', '#226666', '#AA6C39', '#2D882D')
SENSOR_NAMES = {
    '0000075f24dc': 'Living room'
}
Graph configuration has two main elements here: definitions (starting with DEF)
and lines (starting with LINE1 here). Definitions specify the data that is
used for graphing. Here temp:AVERAGE from each sensor’s database file
is redefined as the sensor’s id. Then a line is drawn for each of these sensors
with different color, and the line is labeled with possible name for the sensor id.
defs.append('DEF:' + sensor.id + '=' +
            DATABASE_PATH + sensor.id + '.rrd:temp:AVERAGE')
lines.append('LINE1:' + sensor.id + color + ':' + sensor_name(sensor.id))
Last read value from each sensor is also printed to the graph. Here I simply
couldn’t get the texts to be right-justified and stay under the graph area.
COMMENT: \l is required so that the prints would start from a new line,
last value is read from sensor.id data, and it’s printed after a sensor name.
current_temps = ['COMMENT: \l']
...
current_temps.append('GPRINT:' + sensor.id +
                     ':LAST:' + sensor_name(sensor.id) + '\: %4.2lf\l')
All this outputs a temperature graph for previous 24 hours:
In conclusion
After all, RRDtool does the job is it designed to do. The database file is created before any data is inserted, and it stays the same size no matter how much data is inserted. This could be beneficial for systems that have limited disk sizes: for example if RRDtool is used as a local datastore in sensors with unreliable connectivity. That way measurements can be done even if there is no connection to the master node, and data can be transferred afterwards.
Transferring RRDtool data between nodes would require another blog post. rrdxport supports exporting XML or JSON with specified time intervals, so that could be used.
Generating graphs is good for simple use cases, but ideally one would want an interactive, zoomable graph with tunable parameters in browser. I spent a lot of time to get the chart above, and am not that satisfied with the result.