InfluxDB and Grafana for storing and showing temperature data
As RRDTool wasn’t a perfect tool for storing sensor data, I tried a newer datastore: InfluxDB. It is a database designed specifically for time-series data, such as my tempereture readings here.
For visualizing that data, I used Grafana, The open platform for beautiful analytics and monitoring.
The ansible scripts for this post can be found at Github, namely the playbook tempreader-influxdb.yml.
InfluxDB
Setting up InfluxDB is done in the ansible role influxdb. It will install the server from Influxdata repository, copy its configuration to place, start the server, add a database user with admin rights, create a database and open required ports in ufw firewall.
tempreader-influxdb.yml playbook, relevant parts:
roles:
  - { role: "influxdb", when: "'server' in group_names" }
roles/influxdb/tasks/main.yml:
- name: "add influxdb package repository key"
  apt_key:
    url: "https://repos.influxdata.com/influxdb.key"
    state: "present"

- name: "add influxdb package repository"
  apt_repository:
    repo: "deb https://repos.influxdata.com/debian jessie stable"
    state: "present"

- name: "install influxdb"
  apt:
    name: "influxdb"
    update_cache: "yes"
  notify: "start influxdb"

- name: "copy influxdb.conf"
  template:
    src: "influxdb.conf.j2"
    dest: "/etc/influxdb/influxdb.conf"
  notify: "restart influxdb"

- name: "ensure that influxdb is running before adding admin user"
  meta: "flush_handlers"

- name: "wait for influxdb to start"
  pause:
    seconds: 10

- name: "add influxdb admin user"
  uri:
    url: "http://localhost:{{ influxdb_port }}/query"
    method: "POST"
    body: "q=CREATE USER {{ influxdb_user }} WITH PASSWORD '{{ influxdb_pass }}' WITH ALL PRIVILEGES"
    user: "{{ influxdb_user }}"
    password: "{{ influxdb_pass }}"

- name: "create database"
  uri:
    url: "http://localhost:{{ influxdb_port }}/query"
    method: "POST"
    body: "q=CREATE DATABASE {{ influxdb_dbname }}"
    user: "{{ influxdb_user }}"
    password: "{{ influxdb_pass }}"

- name: "open firewall ports for influxdb"
  ufw:
    rule: "allow"
    port: "{{ item }}"
  with_items:
    - "{{ influxdb_admin_port }}"
    - "{{ influxdb_port }}"
Variables for that role are given in tempreader-influxdb.yml playbook, and eventually in an ansible vault file:
vars:
  influxdb_admin_port: "8083"
  influxdb_port: "8086"
  influxdb_host: "{{ secret.influxdb_host }}"
  influxdb_user: "{{ secret.influxdb_user }}"
  influxdb_pass: "{{ secret.influxdb_pass }}"
  influxdb_dbname: "{{ secret.influxdb_dbname }}"
I have it running on an external server, but you should be able to install it also on a Pi device. The only thing with Grafana is that if you use the cloud-version of Grafana, InfluxDB should be available for connections from the internet.
Readings to InfluxDB
Sending the temperature readings from Pi to database is done with a simple python script that is executed periodically with cron.
tempreader-influxdb.yml playbook:
roles:
  - { role: "onewire", when: "'tempreader' in group_names" }
  - { role: "tempsensor-config", when: "'tempreader' in group_names" }
  - { role: "tempreader-influxdb", when: "'tempreader' in group_names" }
Onewire role is discussed already in post Raspberry Pi and 1-Wire temperature sensor. It will setup the Raspberry Pi’s 1-Wire bus for DS18B20 sensors.
roles/tempsensor-config/tasks/main.yml will setup a JSON file that describes all the available temperature reading sensors so that their 1-Wire ids will have also more meaningful tags in the readings:
- name: "copy temperature sensors config file"
  become_user: "{{ ansible_user }}"
  template:
    src: "sensors.json.j2"
    dest: "{{ script_install_path }}/sensors.json"
roles/tempsensor-config/tasks/main.yml has Jinja2 magic to create a pretty JSON file from ansible data:
{
{% for sensor in sensors %}
  "{{ sensor.id }}": {
    "shortname": "{{ sensor.shortname }}",
    "name": "{{ sensor.name }}"
  }{% if not loop.last %},{% endif %}

{% endfor %}
}
Sensor configuration is defined in group_vars/all/vars.yml:
sensors:
  - id: "05168020fdff"
    shortname: "oloh-tvtaso"
    name: "Olohuone TV-taso"
  - id: "05168043d3ff"
    shortname: "mh-ulko"
    name: "Makuuhuone ulko"
  - id: "05168068aeff"
    shortname: "mh-sisa"
    name: "Makuuhuone sisä"
roles/tempreader-influxdb/tasks/main.yml sets up the temperature reading script: it installs python and required libraries, copies the script, sets up the cron and runs it for the first time.
- name: "install required software from apt"
  apt:
    name: "{{ item }}"
  with_items:
    - "python"
    - "python-pip"

- name: "install python libraries"
  pip:
    name: "{{ item }}"
  with_items:
    - "w1thermsensor"
    - "influxdb"

- name: "install temperature reading script"
  become_user: "{{ ansible_user }}"
  become: true
  template:
    src: "readtemp-influxdb.py.j2"
    dest: "{{ script_install_path }}readtemp-influxdb.py"

- name: "add temperature reading to cron"
  cron:
    name: "read all temperature sensors to influxdb"
    job: "/usr/bin/python {{ script_install_path }}readtemp-influxdb.py"
    minute: "*/1"
    user: "{{ ansible_user }}"

- name: "run temperature reading for the first time"
  become_user: "{{ ansible_user }}"
  become: true
  shell: "/usr/bin/python {{ script_install_path }}readtemp-influxdb.py"
Finally, the interesting part roles/tempreader-influxdb/templates/readtemp-influxdb.py.j2 isn’t after all that special. It will read temperature values with W1ThermSensor and send data to InfluxDB with InfluxDBClient.
Tags for each reading are used from the JSON configuration file sensors.json.
DS18B20 temperature reading range is -55–+125°C, but it will send +85°C on error. Thus, all values above +80°C are filtered out as they wouldn’t be sane anyways in this setup.
from w1thermsensor import W1ThermSensor
from influxdb import InfluxDBClient
import datetime
import platform
import json

dbclient = InfluxDBClient(
    host="{{ influxdb_host }}",
    username="{{ influxdb_user }}",
    password="{{ influxdb_pass }}",
    port={{ influxdb_port }},
    database="{{ influxdb_dbname }}"
)

with open('sensors.json') as f:
    sensor_tags = json.load(f)

measurements = []

for sensor in W1ThermSensor.get_available_sensors():
    temp = sensor.get_temperature()
    if temp < 80: # 85 is an errorcode
        tags = sensor_tags.get(sensor.id, {})
        tags["sensor_id"] = sensor.id
        tags["host"] = platform.node()
        measurements.append({
            "measurement": "temperature",
            "time": datetime.datetime.utcnow().isoformat() + 'Z',
            "tags": tags,
            "fields": {
                "value": temp
            }
        })

print json.dumps(measurements, indent=4, sort_keys=True)
if measurements: dbclient.write_points(measurements)
InfluxDB can be queried manually with an SQL-like syntax:
rh@sokrates:~$ influx -database 'temperature' -username '...' -password '...'
Connected to http://localhost:8086 version 1.4.2
InfluxDB shell version: 1.4.2

> select * from temperature order by time desc limit 10;
name: temperature
time                host           name             sensor_id    shortname   value
----                ----           ----             ---------    ---------   -----
1532181008754363136 rpi-makuuhuone Makuuhuone sisä  05168068aeff mh-sisa     26.062
1532181007874356992 rpi-makuuhuone Makuuhuone ulko  05168043d3ff mh-ulko     23.875
1532181004805038080 rpi-olohuone   Olohuone TV-taso 05168020fdff oloh-tvtaso 28.437
1532180948674241024 rpi-makuuhuone Makuuhuone sisä  05168068aeff mh-sisa     25.812
1532180947794324992 rpi-makuuhuone Makuuhuone ulko  05168043d3ff mh-ulko     23.687
1532180944884818944 rpi-olohuone   Olohuone TV-taso 05168020fdff oloh-tvtaso 28.5
1532180888674245120 rpi-makuuhuone Makuuhuone sisä  05168068aeff mh-sisa     25.75
1532180887794349824 rpi-makuuhuone Makuuhuone ulko  05168043d3ff mh-ulko     23.625
1532180885044857088 rpi-olohuone   Olohuone TV-taso 05168020fdff oloh-tvtaso 28.562
1532180829634234880 rpi-makuuhuone Makuuhuone sisä  05168068aeff mh-sisa     25.562
Grafana
For data visualization, Grafana was easy to set up. I used the hosted grafana as it was free for single user. Grafana can also be installed to your own server.
So there are no ansible scripts for this part. After creating a hosted grafana instance, you can follow the good instructions Using InfluxDB in Grafana. From the main points listed in Grafana’s Home Dashboard, important ones are adding a datasource and creating a dashboard.
Datasource configuration is straightforward, here are the configuration options and respective variables in tempreader-influxdb.yml:
- Type: InfluxDB
- HTTP URL: http://
<influxdb_host>:<influxdb_port> - HTTP Access: Server (Default)
- Auth: nothing selected (database requires authenticated user, but HTTP connection does not)
- InfluxDB Details - Database:
<influxdb_dbname> - InfluxDB Details - User:
<influxdb_user> - InfluxDB Details - Password:
<influxdb_password>
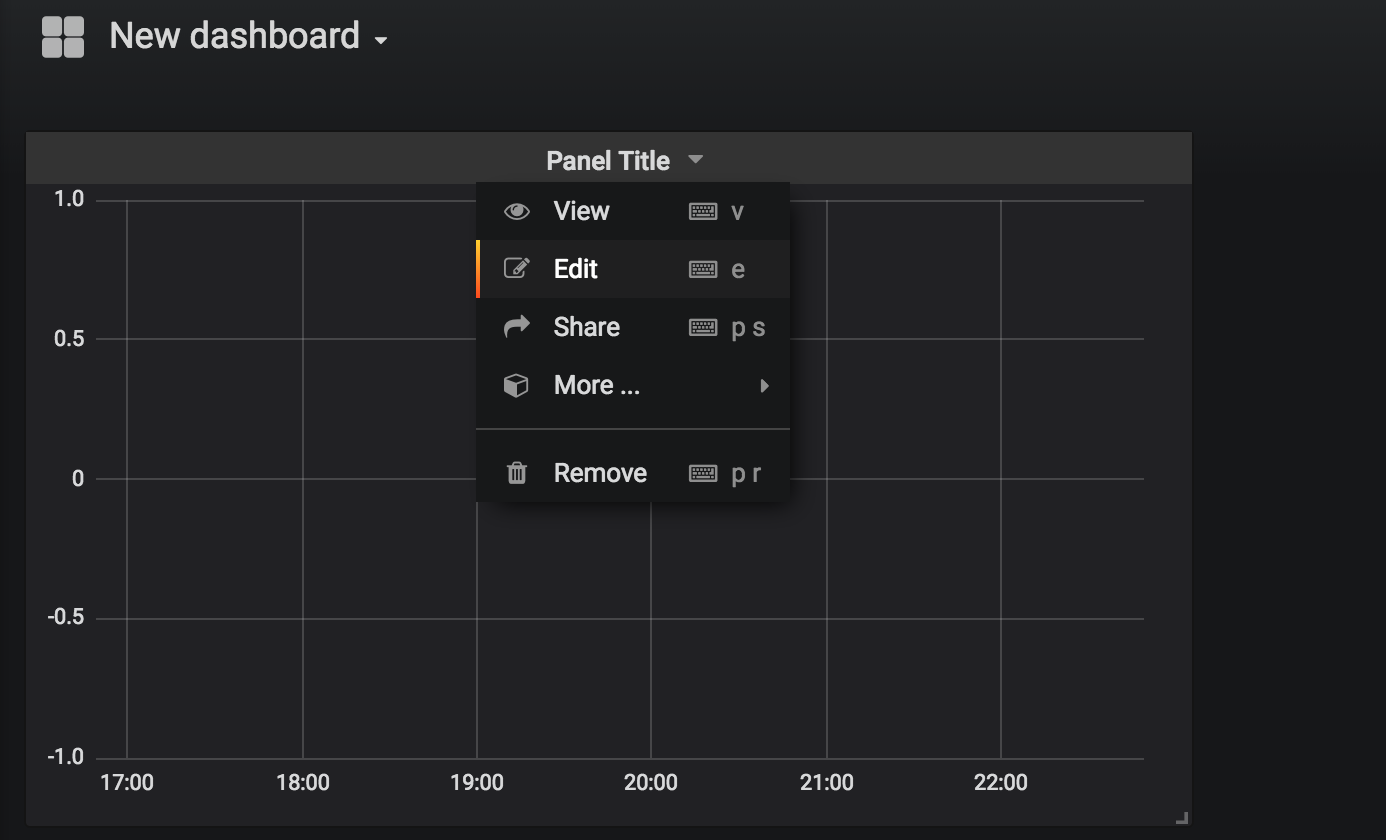
For me, the dashboard configuration wasn’t intuitive at first. After clicking new dashboard and then “Graph”, you’ll end up with a blank panel and no hints on how to go forward. The trick is to click “Panel title” and then “Edit”. Then configure the query as follows:
For the query under “Metrics” tab, set up like this:
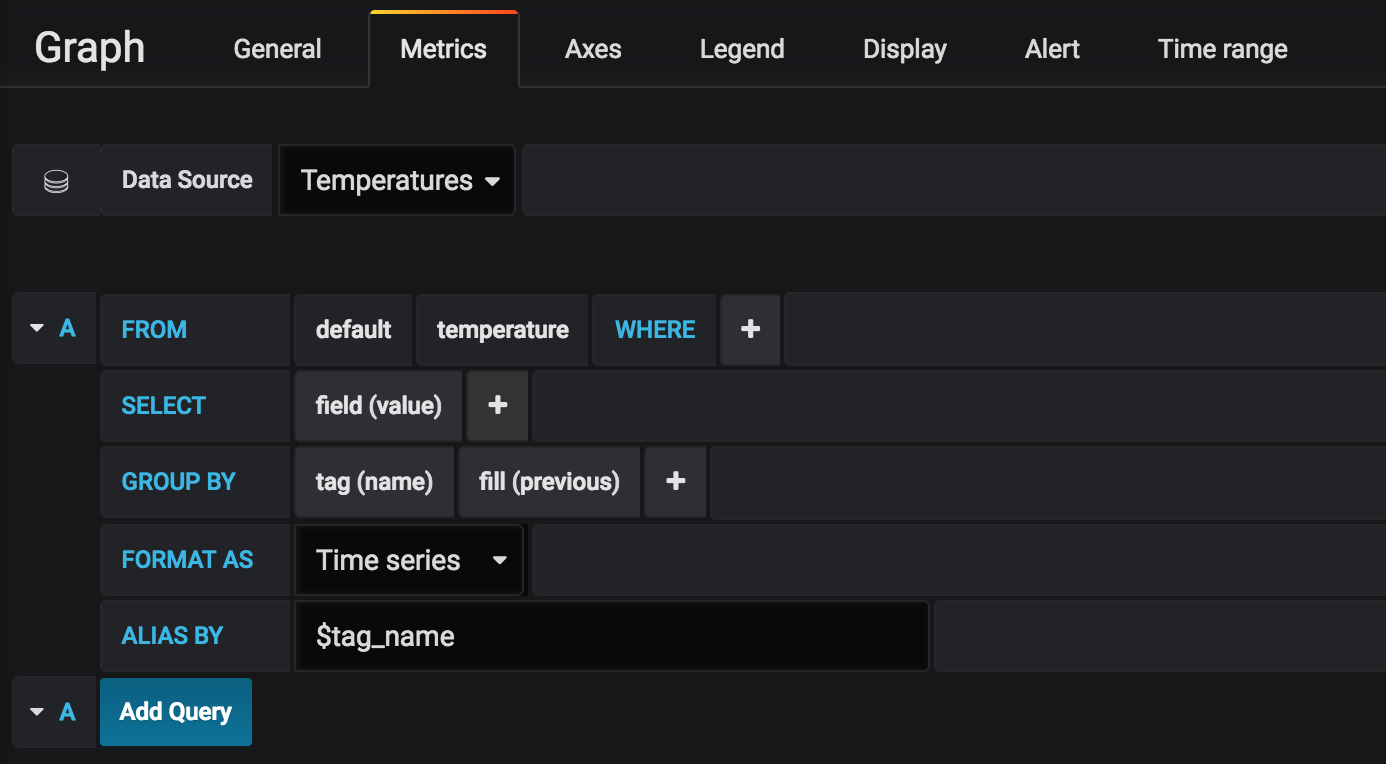
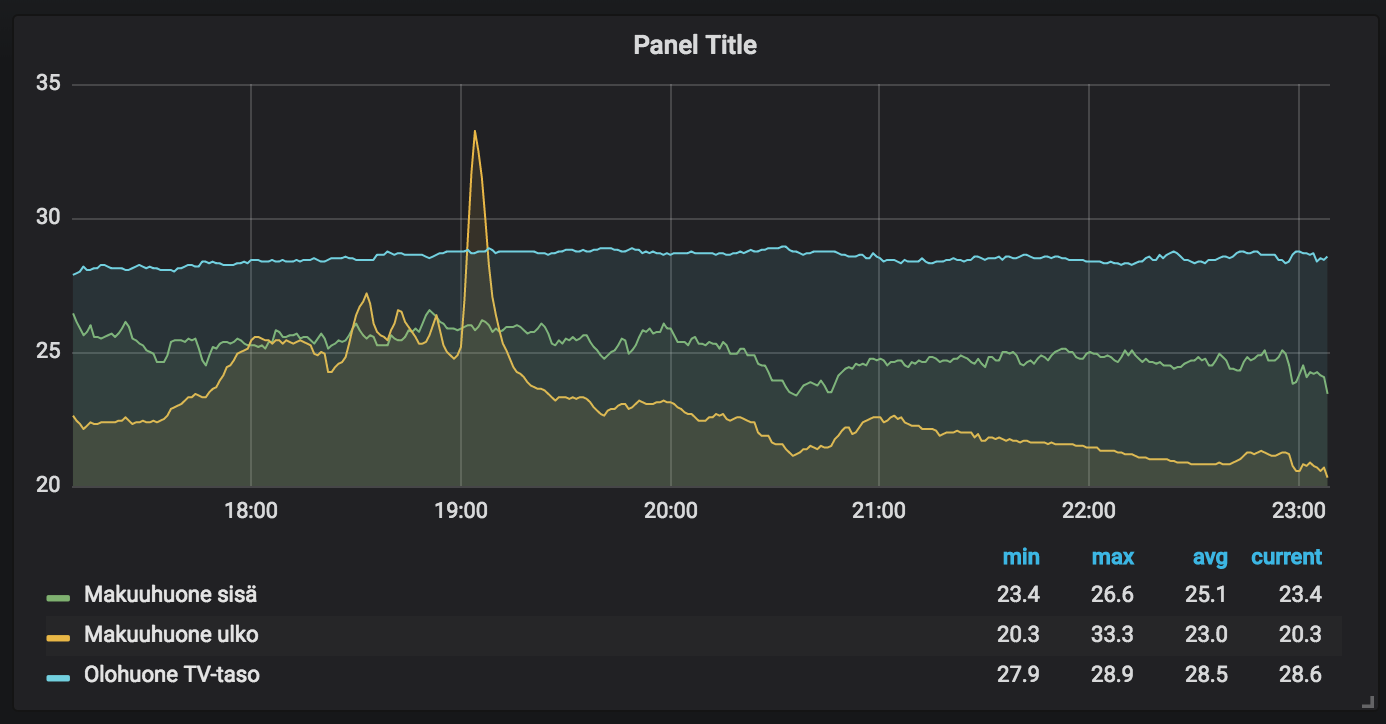
Here the GROUP BY clause will separate the data into one graph per sensor. tag(name) is the best tag for grouping as it will show up in the legend also. fill(previous) will connect the data points in the graph, and selecting previous will make “current” to show the latest data point in the legend.
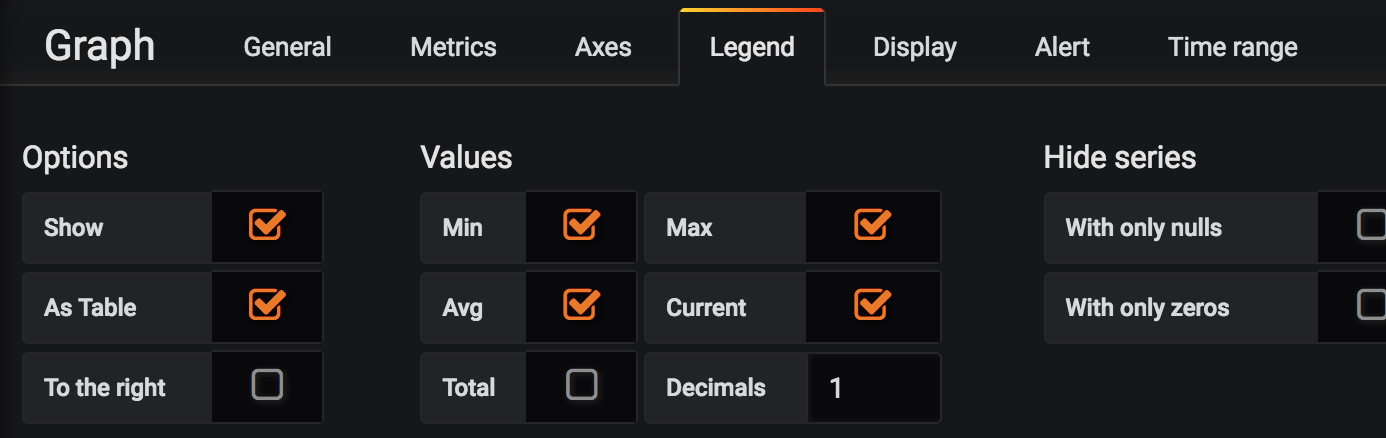
In “Legend” tab, select:
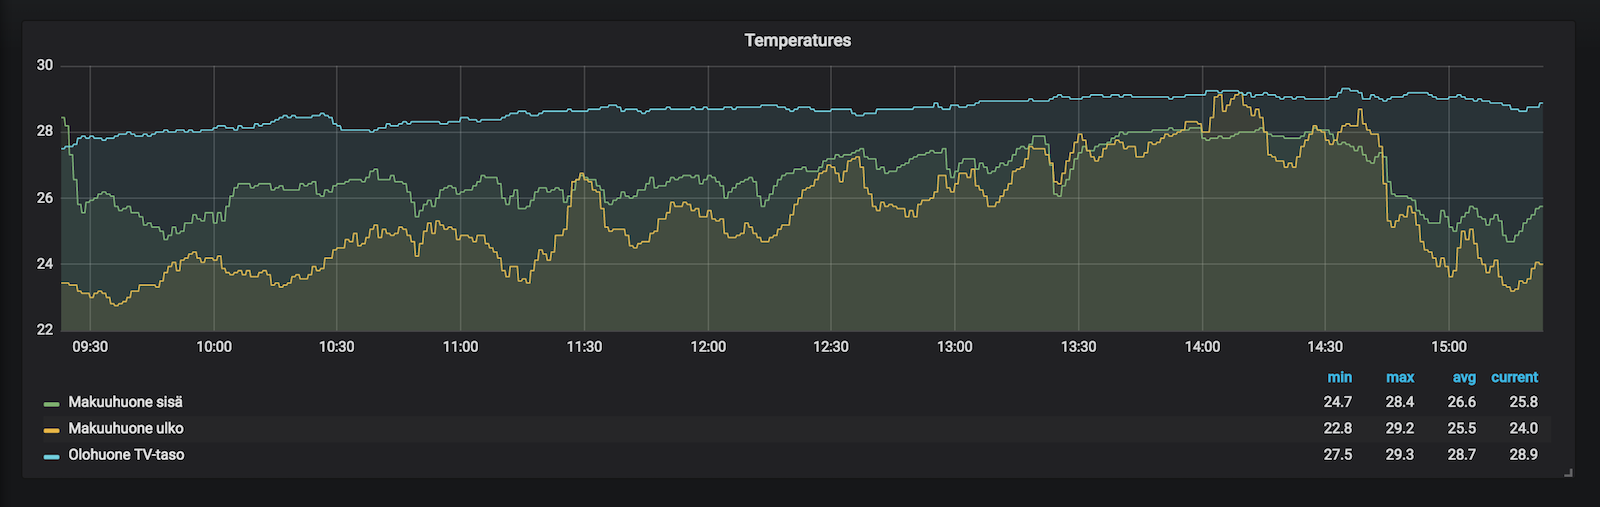
And you’ll have a beautiful graph of your temperature readings!
You can leave questions and comments to Reddit.